This internet marketing report took an in-depth look at an organization's overall web presence and was created during my Search Engine Optimization course (Sep 2016 – Dec 2016). The original report is 37 pages long. I have condensed some of the report and posted it below. To see the full report, click here. The following video is a ten-minute presentation going briefly over the report and its findings.
This project gave me a greater appreciation of the importance of Search Engine Optimization. I learned careful planning and organization are crucial aspects to have a web presence thrive. This was my first time creating a report like this and also a first with making a presentation video to go along with a report.
From the Executive Summary of the Report: This report is designed to look at the current status of the Stout Cru website and make improvements on their overall web presence. The primary goal is to increase the number of people interested in getting involved with the organization. Another goal is to have a good user experience for visitors.
Topics in the Report:
- Current data
- On-site evaluation
- Local evaluation
- Off-site evaluation
- User experience
- Social
- Video
- Paid search
- Competitive analysis
- Proposed strategies & tactics
Current data
This section touches on the current data of the Stout Cru website including overall traffic, search engine traffic, direct traffic, top channels, top sources and mediums, average time on site, and bounce rate. From looking at this data, we can see how users have been interacting with the website.
Some key terms:
- Google Analytics (GA) – Software used to track information about website traffic. This is the tool used to gather analytics on viewers of the Stout Cru website.
- Target Audience – The people you are putting your marketing efforts towards.
- Turnover Rate – The rate of new people coming in to existing people. A high turnover rate is a rapid number of new people coming in.
- Call To Action (CTA) – Something that you want the user to do. For example, clicking the “like” button on Facebook or clicking on a “subscribe” link/button.
- Sessions – One total visit to a website. If a user comes and views multiple pages and then leaves, that would count as one session with multiple page views.
- Users – Visitors to the website
- New Visitor – First time visitor of the website. One person could count for several users if they are viewing the site from multiple devices.
- Returning Visitor – A visitor that has been recorded coming to the site in the past.
- Pageviews – Total number of pages viewed.
- Pages / Session – The average number of pages viewed per session.
- Average Session Duration – The average length of a session.
- Bounce Rate – The percentage of single-page visits. This means that if a user only views one page and then leaves, the bounce rate would be 100% for that user. If a user views multiple pages, their bounce rate would be 0%. So, the Bounce rate percentage would be an aggregate of all users. A lower bounce rate is typically good.
- Landing Page – The first page a user visits.
- Channels – The way a user gets to a website.
- Organic – This would be through a search engine such as Google.
- Direct – This would be typing a URL directly into your browser.
- Social – This would be a link from a social media page such as Facebook.
- Referral – This would be from an external site linking to your website.
- Sources – Similar to a channel, but more specific, this is the way a user gets to a website such as through Google, directly, Facebook, or an external website.
- Mediums – similar to a channel, this would include organic, none (directly), or a referral.
On-site evaluation
On-site factors are things that the organization has control over and can modify fairly simply on their own. Having good content is the most important thing to focus on. After you have a page with good content, you should focus on creating good title tags, meta descriptions, headers and subheaders, tagged images, and making sure your internal links are logically organized (check “some key terms” below).
Never create content just to fill space; always have a reason to have content. At the end of any content you add, you should be able to specifically answer 2 questions: Who is this content for? What does it do to help them take an action? If you cannot answer these two questions with the content, then it probably shouldn’t be added.
One helpful test to check if pages are good or not is to see if a new person can understand what your page is about in under 3 seconds. If they cannot, you should update the page. This can be fixed, for instance, by adding appropriate headers to the page. Giant, dense blocks of text are bad as people want to find information quick and easy without having to parse through a ton of words.
Some tools to analyze a website could include Screaming Frog, Google PageSpeed Insights, GTMetrix, Moz Free Tools (Open Site Explorer, Keyword Explorer, and MozBar), and Google Keyword Planner (if you run ads).
- Screaming Frog – This tool is used to crawl websites, which is something search engines do to see what your site is about.
- Google PageSpeed Insights – This website checks the mobile speed, user experience, and desktop experience of a website and gives suggestions on how to improve these things. Having a quick page loading time is very good. If users have to wait a long time for a page to load, they may just leave the site.
- GTMetrix – This website also checks for page speed and performance to help people optimize their websites. There are more recommendations here, similar to PageSpeed Insights, that mention compression and making things smaller file sizes. Basically, the smaller the file size, the faster the page loads, which in turn provides a better user experience.
- Moz Free Tools (Open Site Explorer, Keyword Explorer, and MozBar) –
- Moz Open Site Explorer focuses on links and authority. Links and authority deal more with off-site factors, however, onsite factors do play some role in these. There will be additional details on links and authority in the Off-Site Evaluation section.
- By looking at Moz Keyword Suggestions, we can see what words are searched quite often. These could be some beneficial keywords to put on a website.
- Another great tool from Moz would be the MozBar extension for your browser. I have used this tool many times in examining the Stout Cru site and other sites. The MozBar shows data on many things including the page title, meta description, H1 and H2 tags, alt text, page load time, PA, and DA. This tool is a very quick and easy way to check for important information on a site.
Some key terms:
- Search Engine Results Pages (SERPs) – The page you see after you click the search button on a search engine.
- Title Tags – These are very important. They show up in SERPs and in the tabs of your browser. Since they are in the tab of a webpage, they should be pretty short so that they can fit within the tab, preferably under 70 characters.
- Meta Descriptions – These are things that visitors to your website will not see on your site, however, they would see this description on a SERP. It is recommended to have meta descriptions under 160 characters. Without meta descriptions, search engines will pull text from your site which may not depict pages most effectively.
- Headers and Subheaders – These would include things such as H1 or H2 tags. Using appropriate heading tags is important as search engines will look at these tags to determine what is on the page. More relevance is given to H1 tags, then H2 tags, and so on down to H6 tags. So, the most important content on a page should be in H1 tags so search engines can easily identify this information.
- Tagged Images – All images should have “Alt” tags. Having a “title attribute” or a “caption” is optional.
- Alt tag – This allows screen readers to tell what images are. If images cannot be displayed, this text is what will show up instead of the image. The alt tag is required to be compliant with disability laws.
- Title Attribute – If you hover over an image, this text is displayed.
- Caption – This provides additional information for an image that is displayed next to the image.
- Internal Links – Links that point to other pages on your own website. Unless you specifically have a purpose in mind to not link to a page, all pages should be easily accessible. Main pages should be accessible via the main navigation bar. A page that may not have a link readily available to people could be something like a “thank you” page for signing up for a newsletter. A visitor should not be able to reach this page unless they actually sign up.
- Chars – Characters, this includes text, symbols, and spaces.
- Domain Authority (DA) – The authority a given website has. The higher the number, the better. Stout Cru, at the time of the report, had a DA of 9/100, which is pretty low.
- Page Authority (PA) – The authority a given web page has. The higher the number, the better. The Home page of Stout Cru, at the time of the report, had a PA of 19/100, which Home pages typically have the highest PA out of the whole website. You shouldn’t focus much on PA but on DA.
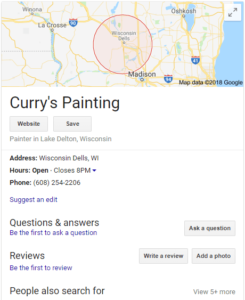
Local evaluation
Local SEO is for organizations with a physical “storefront”. If people are not going to show up at the front door, then local is probably not important. The following image is an example of a local result on a SERP.
Off-site evaluation
The goal of off-site SEO is to influence the popularity of a website. So, what do others say about you? Generally, the more incoming links (called backlinks) you have pointing to your site, the better. But not any link will give much benefit, and some links can actually hurt your site. Here are some important factors that make links valuable:
- Popularity of the link source
- Does this referring site have a good social standing?
- Local / topic popularity
- If you are a local business, do other local businesses link to you?
- If you are a car site, then are other car sites linking to you?
- Relating to Stout Cru, are other Christian ministries pointing to our website?
- As the report shows, there are very few sites pointing to Stout Cru.
- Anchor text
- Do these words make sense?
- Are these words some of our keywords?
- Trust rank
- Is this referring site trustworthy?
- Freshness
- Are the links pointing to our website new? Are the links continuing to grow?
- Value of links decay over time.
- Are the links pointing to our website new? Are the links continuing to grow?
On top of these things .gov and .edu links are more valuable than .com links. Is there a way Stout Cru could get a referral link from the UW-Stout main website? The Stout website has a DA of 68/100, which could give Stout Cru some nice “link juice”. Link juice is a term used in the SEO world that refers to the quality of links. Getting quality backlinks is the fastest way to grow DA.
User experience
Although User Experience (UX) is often evaluated by a site designer, it can be beneficial to evaluate some easily accessible factors to ensure a positive user experience. This can affect your SEO performance (time spent onsite, bounce rate, etc.). Our goal with UX is to make the user’s time on our site a positive interaction. Besides some of the things mentioned prior, like optimizing images, minifying files, and just trying to decrease page loading time in general, the Stout Cru site overall is pretty good as far as UX.
Some things to consider:
- Navigation: Are all pages easily accessible?
- Contact Information: Is the contact information easy to find for the user?
- Visual Appeal: Is the design visually appealing (e.g. color, readability, etc.)?
- Device Usability: Will the site operate well on a PC and a Mobile device?
Social
Knowing your goals as to why you have or want social media is most important before you try to start analyzing data. Always make sure you know who has control of your social accounts and presence.
Some things to pay attention to would be:
- Follower growth rate
- Engagements – Shares/Retweets, Likes, Link Clicks, Video Views
- Conversion (tracking actual business impact)
Three basic rules for all social media – All content needs to be:
- Valuable
- Even if the person is never to become a customer, it would be worth their time and worth their effort to engage with your content. “Wow, that’s Cool!”
- Original
- What makes you stand out from the crowd? Something that is different, new, and unique to engage with the audience.
- Credible
- Many people can tell, especially in niche markets, if something was created only for marketing purposes versus someone who really understands the business, industry, or activity that you are trying to market. Using industry jargon is a good thing when trying to reach that specific niche.
Basically, make the content really cool – don’t just use text. Also, don’t only publish posts, have conversations with your audience. Engage with them; talk with them, not at them. Encourage others in the organization to engage with your social media presence.
Video
There are 7.4 billion people on Earth as of July 2016. Over one billion are using YouTube. There are over 4 billion new videos added daily to YouTube. This equates to 300 hours of video uploaded per minute with 6 billion hours of video watched daily. YouTube represents over 36 billion searches annually which is more than Bing, Yahoo, Ask, and AOL combined. Google represents over 2 trillion searches annually. These statistics show how important being on YouTube is as marketers.
When creating video titles, use words that would be similar to how people would search for something. Make sure to do lots of planning before you start shooting a video. Post-production editing takes a lot of time – use storyboards. There are 3 types of videos which include transactional, educational, and entertainment. KPI stands for Key Performance Indicator, which is an important metric to pay attention too.
Paid search
Does it make sense to run a paid campaign for the website or for social platforms such as Facebook or YouTube? As with any type of marketing, make sure to understand your target audience well before you purchase advertisements.
Competitive analysis
The Competitive Analysis is an evaluation of competitors in the marketplace. This data is important in determining why your site is not ranking as well as other organizations and uncovers areas for improvement. Data in this analysis has some info from previous sections of this report, such as DA. An older domain age gives a more positive result to search engines.
Proposed strategies & tactics
This section specifically lays out some of the issues I see on-site and what recommendations can be implemented to improve Stout Cru’s website performance. These recommendations are considering that resources are limited.
- Improve the Home Page
- Use subdomains or subdirectories
- Create more videos to engage your audience
- Increase link juice
- Decrease page loading times
- Add Meta Descriptions